Dashboard Mania! (PLUS: spankin’ new feature today)
Simpleology Dashboard mania is in full swing!
After the post about The Complexity Gap, folks are waking up to the importance of narrowing their focus. (A hearty thanks to everyone who has written in to tell us the difference it’s making already. That’s what we love to hear.)
Side note … if you haven’t read about The Complexity Gap yet, do yourself a favor and go do that now. This post won’t make as much sense without that context. And hey … it’s a lot of fun to read and extremely important.
Now …
Today’s post may get a little heady for a moment. Bear with me. There are some enormous performance gains to be had here.
The cost? Just a few moments of breezy mental calisthenics.
Ready? Let’s go!
Here’s a common problem I see folks running into: they’re narrowing their focus, but … if they tweaked their focus just a tiny bit they could multiply their results severalfold. The problem is, most of the tools we use to measure things just aren’t that smart.
To fix this, we’ve added a new feature to the Dashboard. Let’s learn all about it by looking at a couple of common scenarios …
1. The number dieters should actually be tracking (hint: it’s not BMI or body fat %)
Body fat percentage is the gold standard for measuring diet progress. We know that muscle weighs more than fat so “losing weight” isn’t necessarily a desirable thing. Tracking your body fat percentage is a far better idea than tracking body weight.
But at the risk of blaspheming the fitness gods … I’m going to say that we can do even better.
See, here’s the problem with body fat percentage …
- it’s a percentage of total weight
- total weight includes total water weight
- water weight fluctuates wildly (up to 4 pounds a day)
- this can trick you into thinking your body fat has changed wildly when it hasn’t
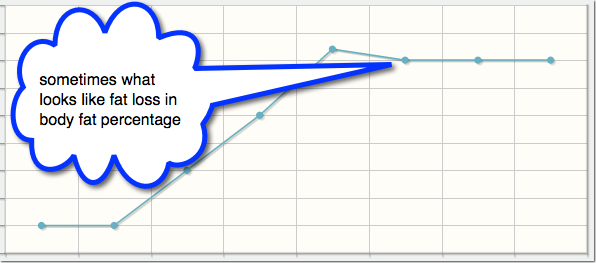
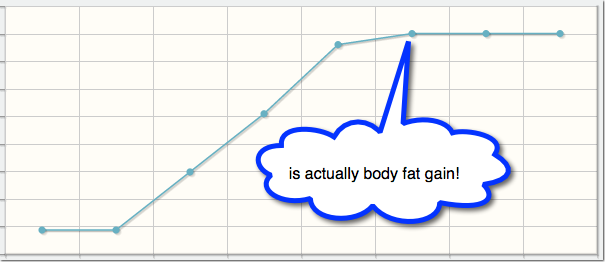
Imagine someone weighing 100 pounds and their body fat measurement is 20%. That’s 20 pounds of fat, right? So far so good … But what if their next measurement is at a time when their weight is at 104 and all of the difference is water?
You guessed it – their body fat percentage would be 19.2%. ”Woohoo! My body fat went down a whole point!” You also guessed it – their total body fat didn’t change at all. Only the percentage relative to their waterlogged weight did – thus creating the illusion of progress.
And even worse …
Crazily, body fat scales don’t tell you “body fat weight.” They know your body weight. They know your fat percentage. It’s a simple math function to figure out the total fat weight …
(body weight)(body fat %) = fat weight
Why don’t they tell you this?
The new Tracker Math function of the Dashboard to the rescue!
All you have to do is set up Trackers for body weight and body fat %. Then on your Dashboard, add a widget with Tracker Math, …
![]()
… follow the steps to define a math function, and voila! You now have a much more relevant measurement to inspire you each day on your Dashboard. This will allow you to make far better decisions about your fitness and get results much faster, of course.
2. How much are your team members actually worth?
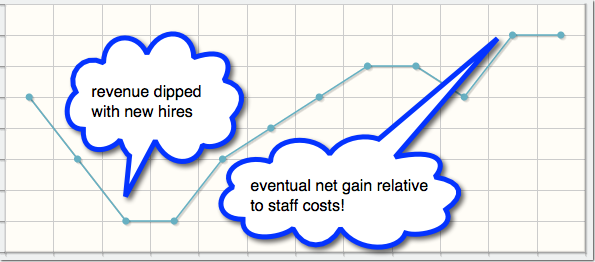
So, let’s say you’re a business owner and just hired some new folks. Awesome. You just created new jobs and (hopefully) expanded the capacity of your business. But was it a profitable decision? You can’t know in advance. You’ll only know in retrospect. So how do you know?
The traditional answer would be to look at Net Profit and it’s hard to argue with this wisdom. Profit is profit and you’re either makin’ it or you’re not.
But what is the cause? While the following method is not foolproof, and it fails to remove all confounding variables, it gives you more information than Net Profit alone.
Step 1. Set up a tracker for Net Profit
Step 2. Set up a tracker for Staff Costs.
Step 3. Add a widget to your Dashboard using Tracker Math with the following math function:
Net Profit (minus) Staff Costs = Net Staff Impact on Profit
Like all measurements it’s imperfect, but it tells you your profit relative to staff costs. If you watch this number over time you can see if your Staff Costs are increasing Net Profit (as they should if you’re making good hiring decisions), remaining constant (as they will if you are adding staff in a way that isn’t actually impacting real growth), or decreasing Net Profit (as they will if you’re making poor decisions).
When would you want to do this? Well, if you’re a larger company it would be smart to have your Human Resources Director track this number as one of their KPIs (“key performance indicators”).
What if you’re a small startup? Next time you bring in some new blood, maybe you as the CEO should track this number for a while. It will certainly make you aware of the impact of those decisions. Heck, without this you probably won’t even remember to think about it you’ll be so preoccupied dancing the startup shuffle.
Better decisions faster = more profit faster.
3. What’s next?
Given than you can write math functions of nearly limitless complexity with this feature, and that you can create Tracker Math with drag and drop ease, I encourage you to use your imagination and experiment.
Ratios … differences … multiples … school made most of us afraid of these things, but when you look at it, they’re really very simple ideas. How do things relate to each other? That’s really all this universal language is saying.
Maybe your first few attempts won’t render anything useful, but why not have fun with it and try?
Can you think of any clever ways to use this new feature? I bet you can. Jot down some ideas in the comments below …
Our live webinar titled “See the Battlefield Military Tricks for an Unfair Advantage in Business” will be held in a few days. I’ll be there live after the webinar to answer your questions in realtime. Click here to learn more …